Generative AI (GenAI) and Large Language Models (LLMs) are moving into domains once seen as uniquely human—reasoning, synthesis, abstraction, and rhetoric. Addressed to (labor) economists and informed readers, this paper clarifies what is truly new about LLMs, what is not, and why it matters. Using an analogy to autoregressive models from economics, we explain their stochastic nature, whose fluency is often mistaken for agency. We situate LLMs in the longer history of human–machine outsourcing, from digestion to cognition, and examine disruptive effects on white-collar labor, institutions, and epistemic norms. Risks emerge when synthetic content becomes both product and input, creating feedback loops that erode originality and reliability. Grounding the discussion in conceptual clarity over hype, we argue that while GenAI may substitute for some labor, statistical limits will preserve a key role for human judgment. The question is not only how these tools are used, but which tasks we relinquish and how we reallocate expertise in a new division of cognitive labor.
Paper (Ifo series): https://www.ifo.de/en/cesifo/publications/2025/working-paper/notes-world-generative-ai
Category: Research
The Behavioral Signature of GenAI in Scientific Communication
We examine the uptake and measurable effects of GPT-assisted writing in economics working paper abstracts. Focusing on the IZA discussion paper series, we detect a significant stylistic shift following the public release of ChatGPT-3.5 in March 2023. This shift appears in core textual metrics—including mean word length, type-token ratio, and readability—and reflects growing alignment with machine-generated writing. While the release of ChatGPT constitutes an exogenous technological shock, adoption is endogenous: authors choose whether to incorporate AI assistance. To capture and estimate the magnitude of this behavioral response, we combine stylometric analysis, machine learning classification, and prompt-based similarity testing. Event-study regressions with fixed effects and placebo checks confirm that the observed shift is abrupt, persistent, and not attributable to pre-existing trends. A similarity experiment using OpenAI’s API shows that post-ChatGPT abstracts more closely resemble their GPT-optimised counterparts than do pre-ChatGPT texts. A classifier trained on these variants achieves 97% accuracy and increasingly flags post-March 2023 abstracts as GPT-like. Rather than indicating wholesale substitution, our findings suggest selective human–AI augmentation in professional writing. The framework introduced here generalises to other settings where writing plays a central role—including resumes, job descriptions, legal briefs, research proposals, and software documentation.
Paper: https://www.iza.org/publications/dp/18062/the-behavioral-signature-of-genai-in-scientific-communication
Toll Index September 2024
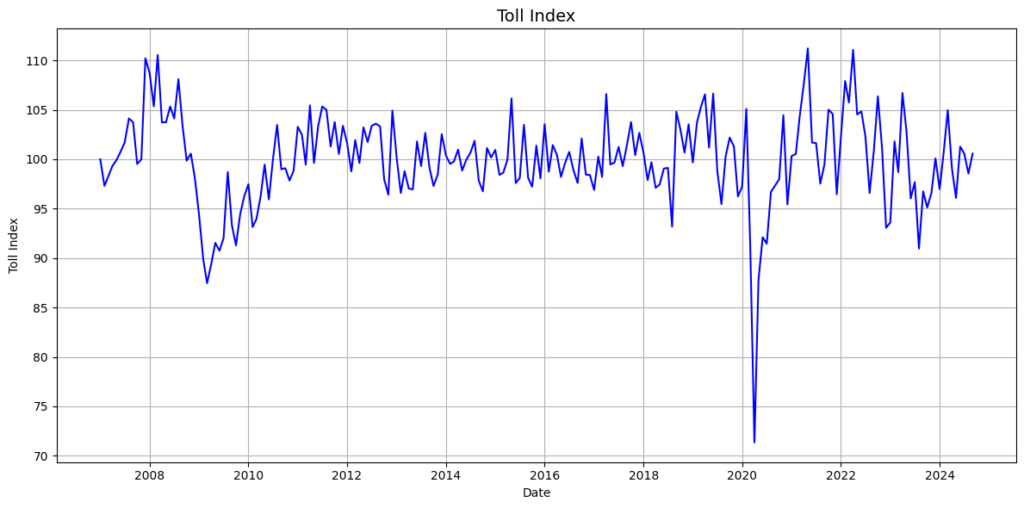
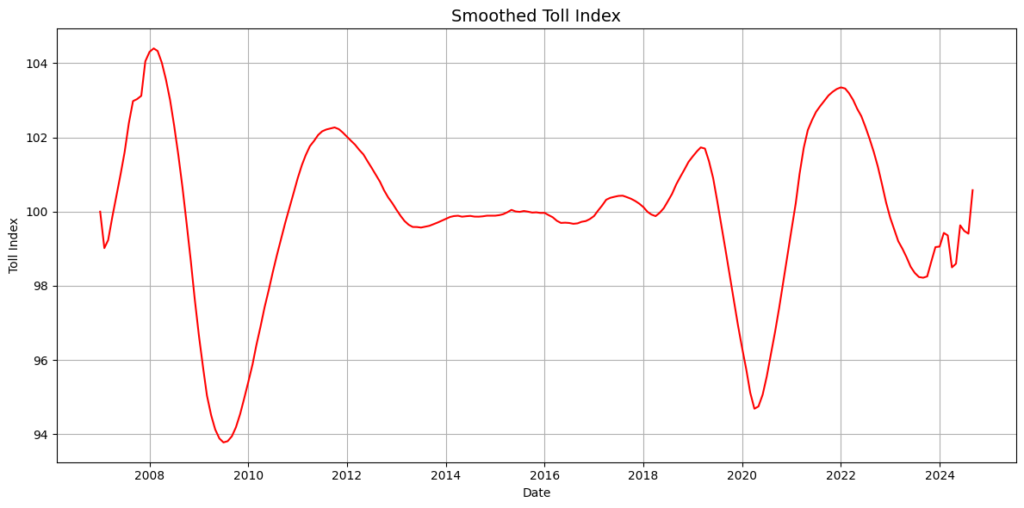
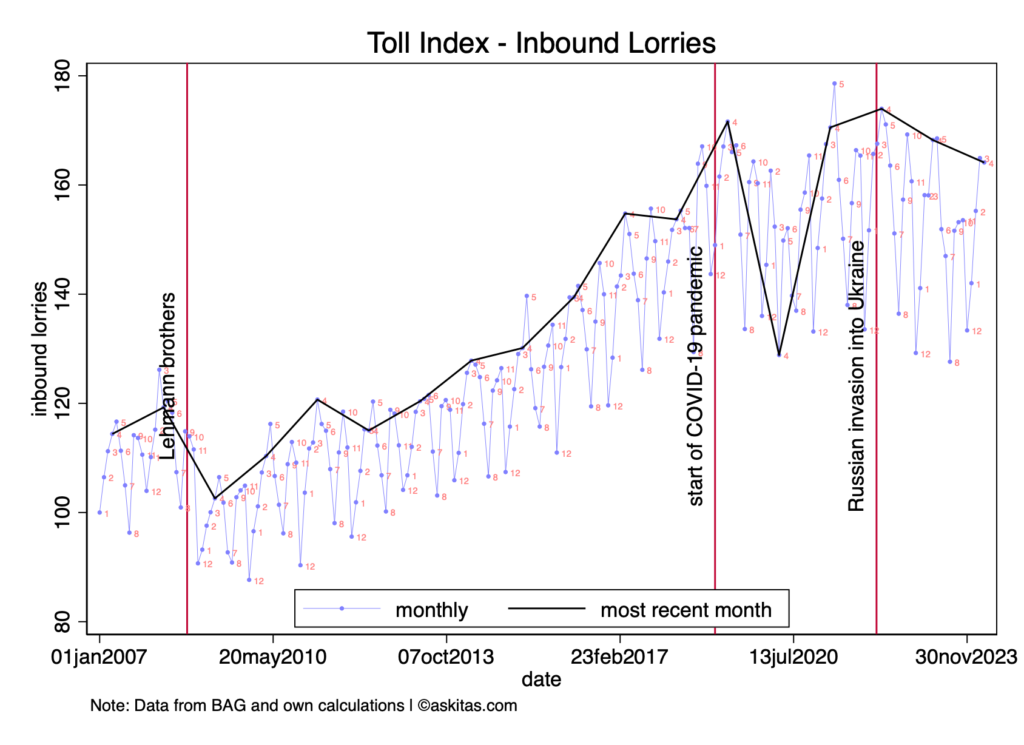
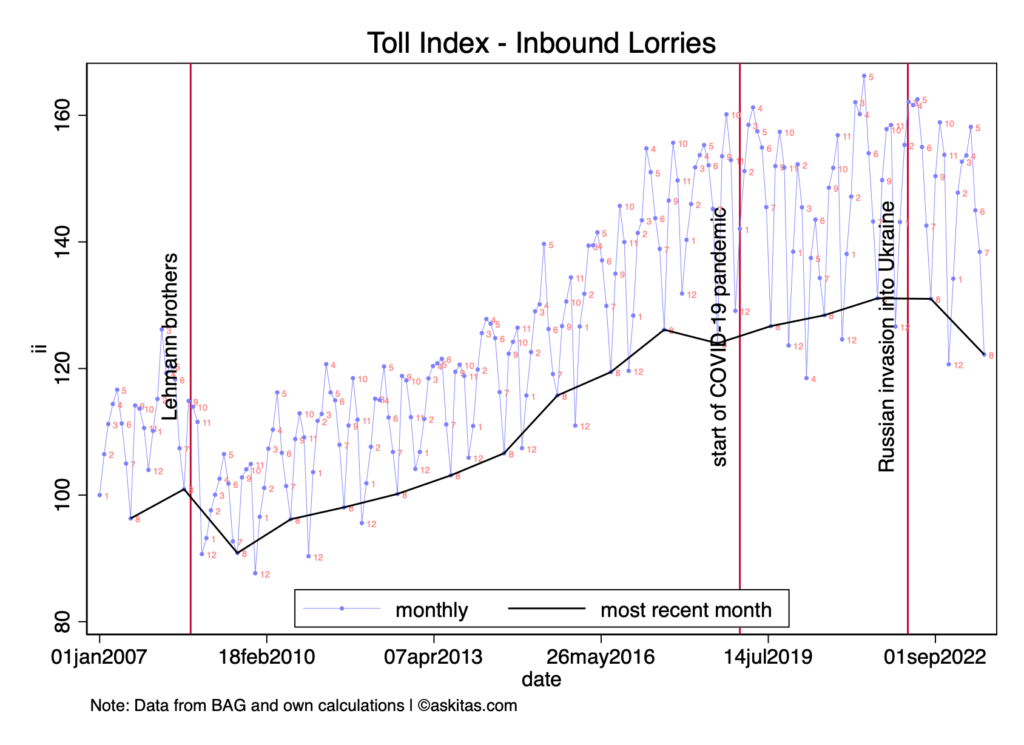
The September value of the Border Crossing Toll Index (just out) adjusted for number of weekdays, time, month and MAUT-policy-regime fixed effects (Figure 1) came at 100.6 continuing an improving trend of several months as can easily be seen in Figure 2 (smoothed). For the newly defined Toll Index see here.
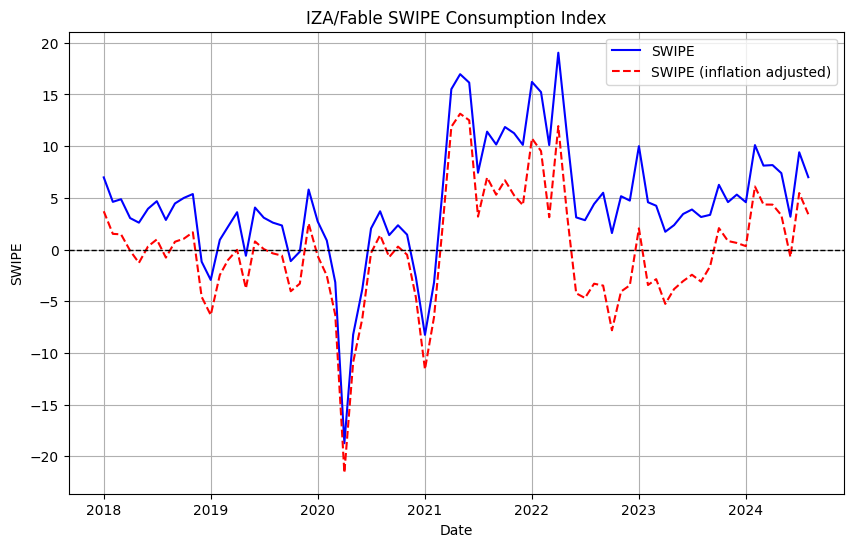
Additionally Figure 3 shows the IZA/Fable SWIPE consumption index (raw in blue and adjusted for inflation in red). While neither goods transportation nor consumption is particularly strong they are both on a clear positive trend indicating that the Fall assessment of the German government which expects a .2% contraction for the year might be overly and unnecessarily pessimistic.
Toll Index April 2024
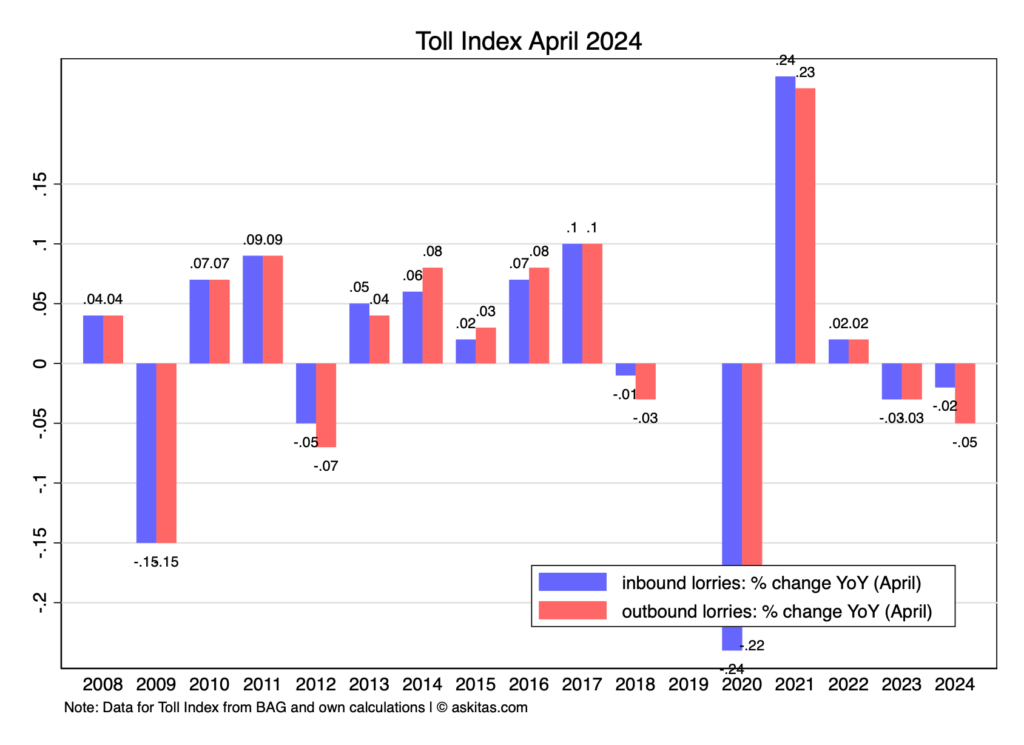
Starting in July 2018 the BAG – Bundesamt für Güterverkehr introduced yet another policy change which affected how lorries pay tolls within the MAUT system as well as the data that come out of this process which are used for computing the Toll Index. The change expanded the network of roads in which toll is due by adding all bundesstraßen to it.
While in the long run this is bound to make the Toll Index more accurate this introduced a discontinuity. The BAG even had difficulty producing the numbers timely for about year. After July 2019 we can report year on year changes for each month (with a missing value in 2018 for all months from July to December and a missing value in 2019 for all months from January to June.
The Toll Index was first proposed in IZA DP5522 which was published in the Journal of Forecasting. It has been widely covered in national and international media (selection):
Focus Magazin,
Tim Harford – The undercover economist,
Financial Times,
MoneyWeek,
WirtschaftsWoche,
CNN International,
DRS3 Swiss public radio,
Deutsche Welle.
The German statistical office, in cooperation with the Bundesamt für Güterverkehr, has taken the MAUT data in its portfolio of data products and their efforts can be found here. The Destatis document describing the data is here and here is their publication calendar for 2019.
Citation: “Nowcasting business cycles using toll data.” Journal of Forecasting 32:4 (2013): 299–306(with K. F. Zimmermann).
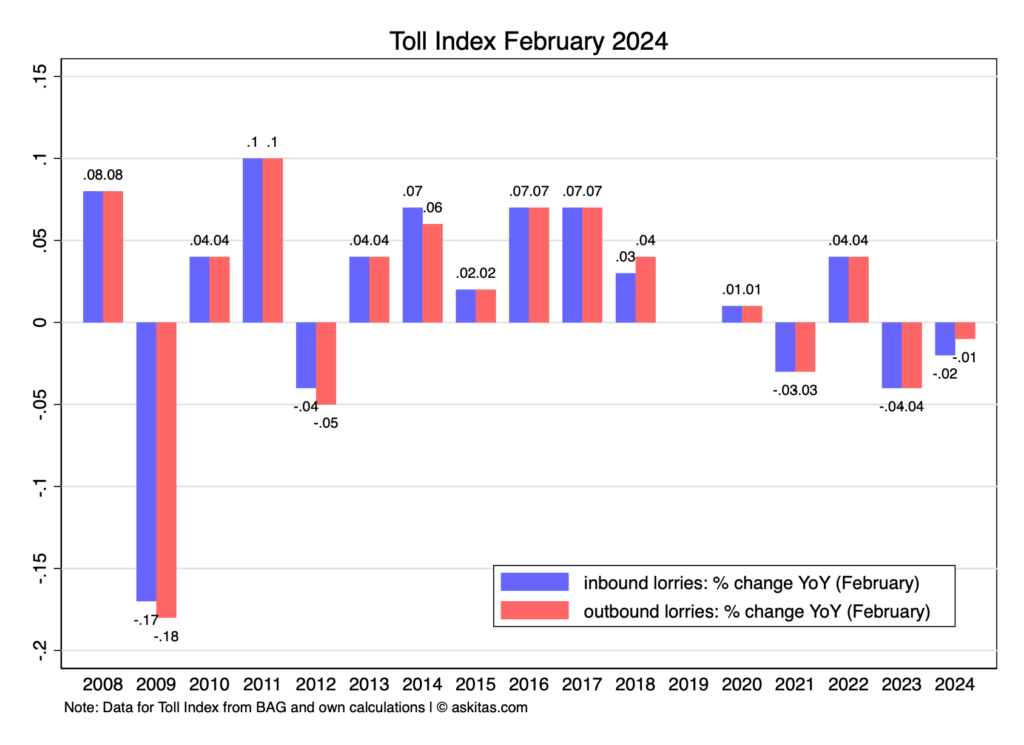
Toll Index February 2024
Starting in July 2018 the BAG – Bundesamt für Güterverkehr introduced yet another policy change which affected how lorries pay tolls within the MAUT system as well as the data that come out of this process which are used for computing the Toll Index. The change expanded the network of roads in which toll is due by adding all bundesstraßen to it.
While in the long run this is bound to make the Toll Index more accurate this introduced a discontinuity. The BAG even had difficulty producing the numbers timely for about year. After July 2019 we can report year on year changes for each month (with a missing value in 2018 for all months from July to December and a missing value in 2019 for all months from January to June.
The Toll Index was first proposed in IZA DP5522 which was published in the Journal of Forecasting. It has been widely covered in national and international media (selection):
Focus Magazin,
Tim Harford – The undercover economist,
Financial Times,
MoneyWeek,
WirtschaftsWoche,
CNN International,
DRS3 Swiss public radio,
Deutsche Welle.
The German statistical office, in cooperation with the Bundesamt für Güterverkehr, has taken the MAUT data in its portfolio of data products and their efforts can be found here. The Destatis document describing the data is here and here is their publication calendar for 2019.
Citation: “Nowcasting business cycles using toll data.” Journal of Forecasting 32:4 (2013): 299–306(with K. F. Zimmermann).
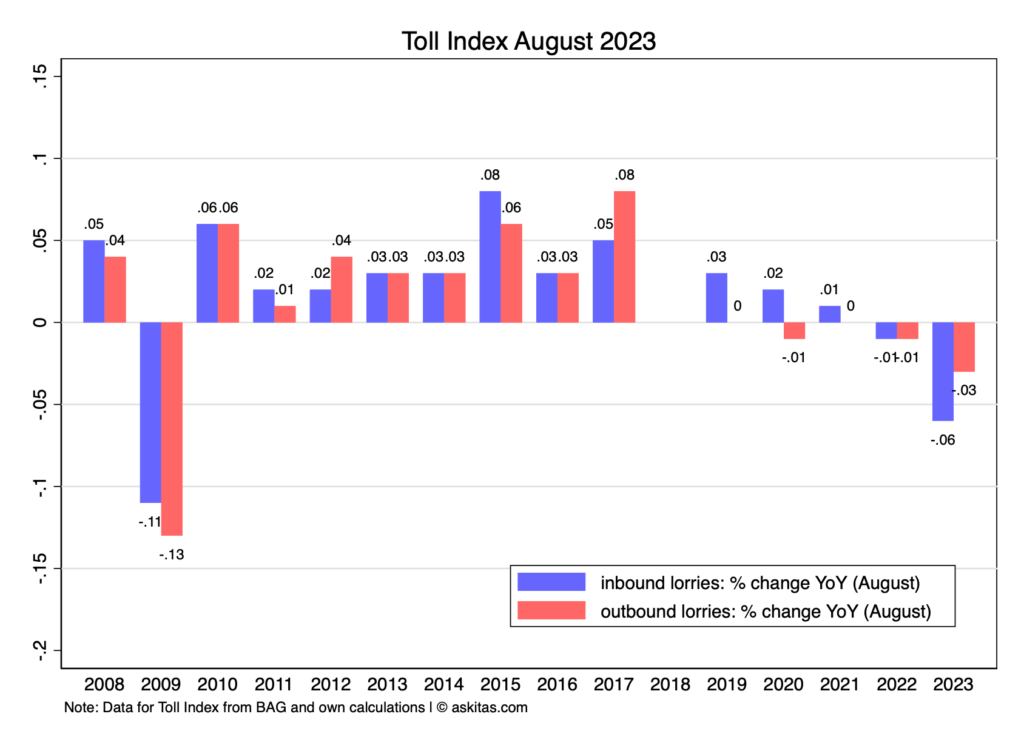
Toll Index August 2023
Starting in July 2018 the BAG – Bundesamt für Güterverkehr introduced yet another policy change which affected how lorries pay tolls within the MAUT system as well as the data that come out of this process which are used for computing the Toll Index. The change expanded the network of roads in which toll is due by adding all bundesstraßen to it.
While in the long run this is bound to make the Toll Index more accurate this introduced a discontinuity. The BAG even had difficulty producing the numbers timely for about year. After July 2019 we can report year on year changes for each month (with a missing value in 2018 for all months from July to December and a missing value in 2019 for all months from January to June.
The Toll Index was first proposed in IZA DP5522 which was published in the Journal of Forecasting. It has been widely covered in national and international media (selection):
Focus Magazin,
Tim Harford – The undercover economist,
Financial Times,
MoneyWeek,
WirtschaftsWoche,
CNN International,
DRS3 Swiss public radio,
Deutsche Welle.
The German statistical office, in cooperation with the Bundesamt für Güterverkehr, has taken the MAUT data in its portfolio of data products and their efforts can be found here. The Destatis document describing the data is here and here is their publication calendar for 2019.
Citation: “Nowcasting business cycles using toll data.” Journal of Forecasting 32:4 (2013): 299–306(with K. F. Zimmermann).
Toll Index November 2022
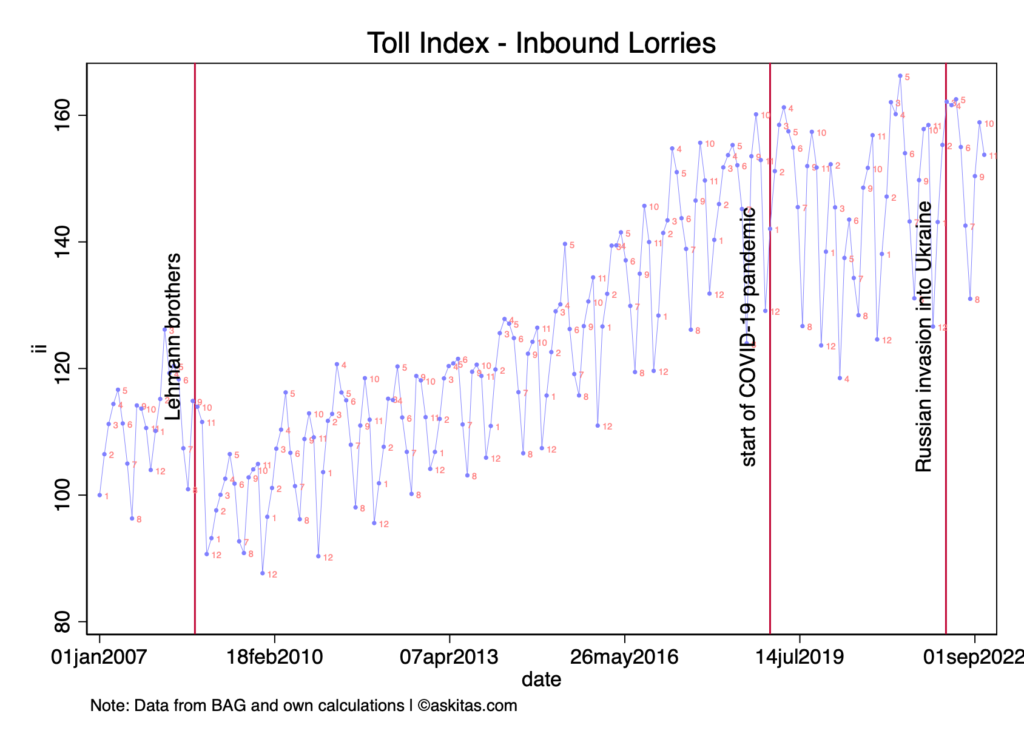
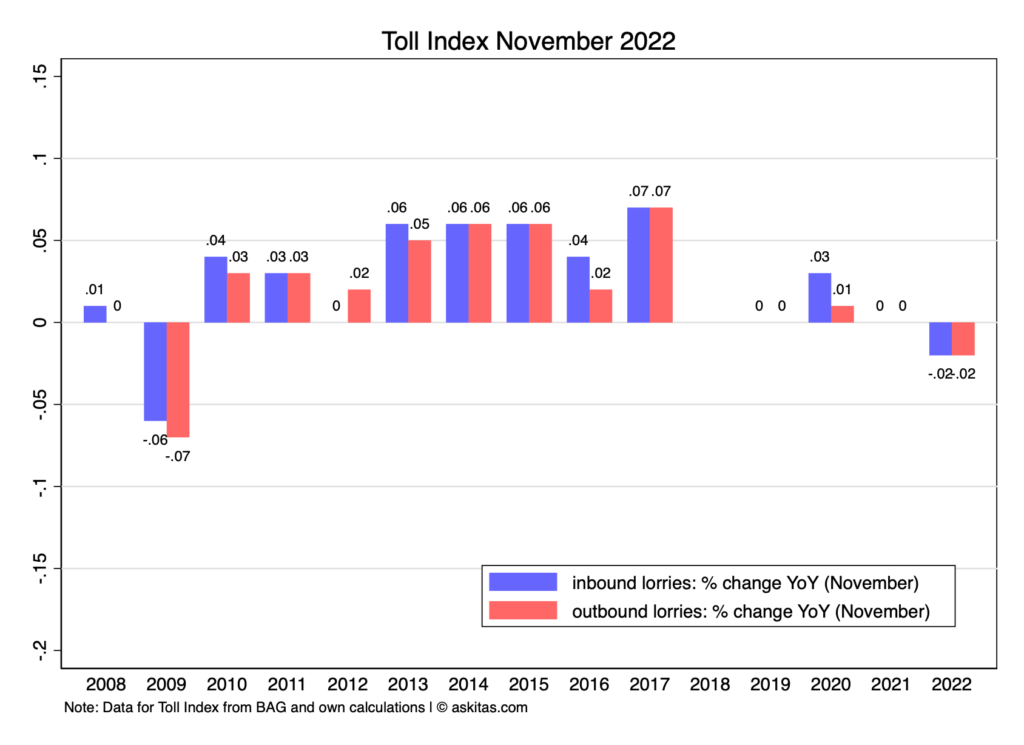
Starting in July 2018 the BAG – Bundesamt für Güterverkehr introduced yet another policy change which affected how lorries pay tolls within the MAUT system as well as the data that come out of this process which are used for computing the Toll Index. The change expanded the network of roads in which toll is due by adding all bundesstraßen to it.
While in the long run this is bound to make the Toll Index more accurate this introduced a discontinuity. The BAG even had difficulty producing the numbers timely for about year. After July 2019 we can report year on year changes for each month (with a missing value in 2018 for all months from July to December and a missing value in 2019 for all months from January to June.
The Toll Index was first proposed in IZA DP5522 which was published in the Journal of Forecasting. It has been widely covered in national and international media (selection):
Focus Magazin,
Tim Harford – The undercover economist,
Financial Times,
MoneyWeek,
WirtschaftsWoche,
CNN International,
DRS3 Swiss public radio,
Deutsche Welle.
The German statistical office, in cooperation with the Bundesamt für Güterverkehr, has taken the MAUT data in its portfolio of data products and their efforts can be found here. The Destatis document describing the data is here and here is their publication calendar for 2019.
Citation: “Nowcasting business cycles using toll data.” Journal of Forecasting 32:4 (2013): 299–306(with K. F. Zimmermann).